
Visualizing XDebug Traces
As alluded to in yesterday's post, I'm currently hunting an elusive bug with xdebug.
The problem is, that it only happens sporadically and when I know it happend it is too late to set a break point. So usual debugging methods don't work. Instead I want to use xdebug's execution tracing: let it log all function calls and then pick through the log when the bug occurs.
Now, the trace function offers three different formats set in the xdebug.trace_format option:
- 0 - a human readable plain text format
- 1 - a computer readable plain text format
- 2 - simple HTML (basically the first format wrapped in a table)
However for what I want, I found the human readable formats much too verbose. A full function trace of a page load in DokuWiki has about 25k lines.
To ease my debugging I looked for tools that could read the computer readable format. I found a few promising candidates, but in the end they either didn't work or they did not provide what I needed. So instead of hunting the bug, I built a tool:
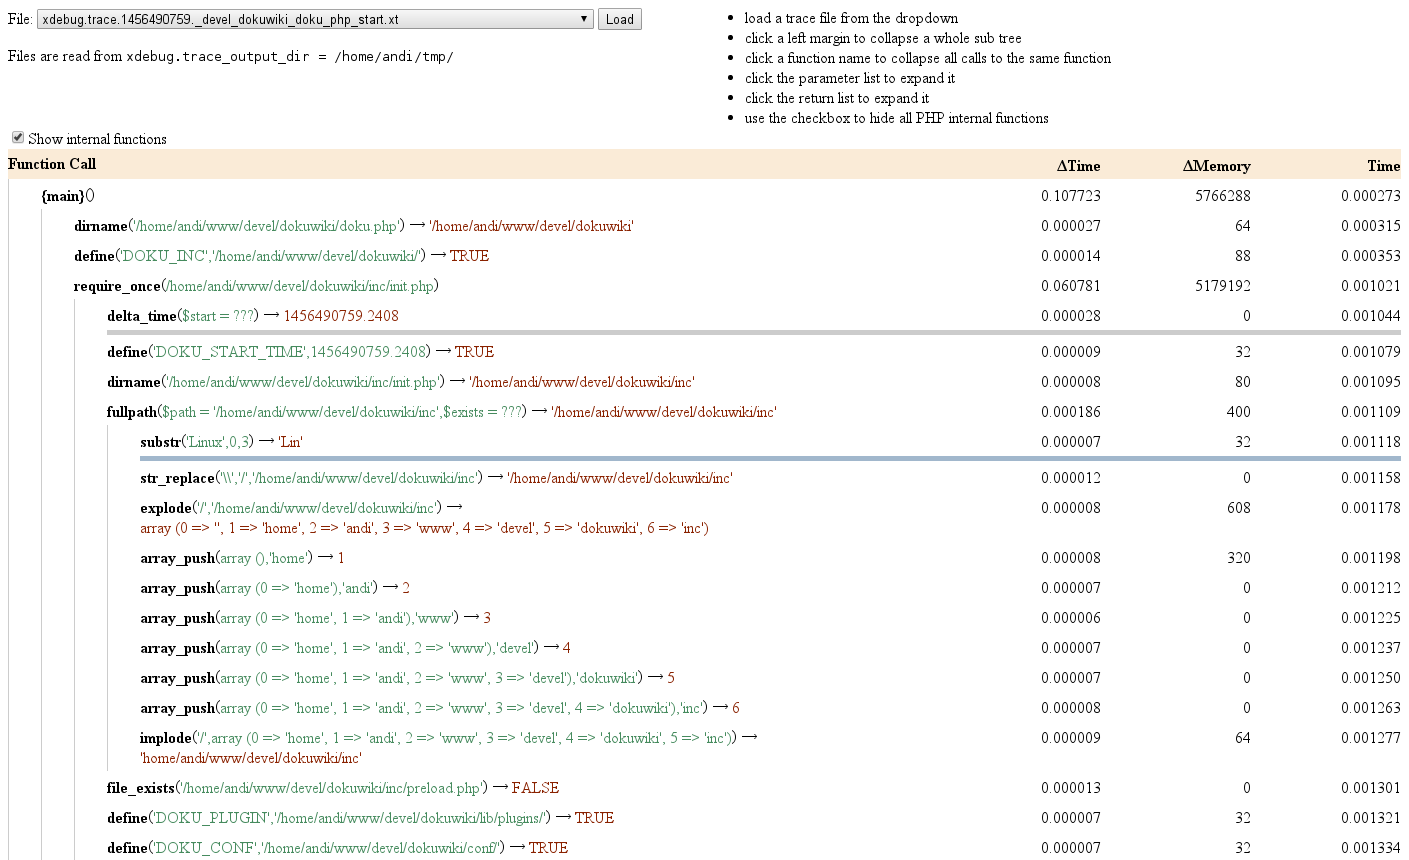
It's a very simple PHP script that parses and outputs the function trace. A bit of CSS and some jQuery makes it easy to collapse parts you're not interested in. Eg. you can hide all PHP internal functions and you can hide functions by clicking their name. You can also hide whole blocks of code.
You'll find the code at Github.
Now back to finding that bug…