Understanding PHP code better with Xdebug

Xdebug is a PHP extension which helps you to understand, debug and profile PHP. It can help you to find bottlenecks or give you an quick overview what happens in code you aren't familiar with, yet.
This post explains how to install Xdebug on Debian and gives a quick introduction how to use it.
Installation
Getting Xdebug running on a Debian system is dead simple. Just get it through PECL and build a Debian Package from it:
#> apt-get install php5-dev php-pear dh-make-php
#> dh-make-pecl --only 5 xdebug
#> cd php-xdebug
#> dpkg-buildpackage
#> cd ..
#> dpkg -i php5-xdebug*
This will install the xdebug extension somewhere below /usr/lib/php5/. Check the directory for the exact path, because you will need it in just a second.
Next create a /etc/php5/apache/conf.d/xdebug.ini file with the following content. Make sure the path is matching your system of course.
zend_extension = /usr/lib/php5/20060613+lfs/xdebug.so

xdebug.profiler_output_dir = /tmp/
xdebug.profiler_output_name = cachegrind.out.%s
xdebug.profiler_enable = 0
xdebug.profiler_enable_trigger = 1
xdebug.show_mem_delta = 1
After changing the config file you will need to restart Apache. The config above will load the extension, makes profiling available on request and puts memory info in trace files.
Profiling
Profiling will log all steps your PHP script takes. It also records how much time is spent in each step. This info is logged in a file named after the script you profiled in the directory you configured in the xdebug.profiler_output_name option above. Make sure this directory is writable by the webserver. Those logs can get really huge, make sure you have enough free space. A run of DokuWiki rendering the syntax page will take about 15MB but other applications are known to create up to 500MB.
The file format used by Xdebug for these logs is taken from the popular Cachegrind profiler. To analyze it you'll need another free tool called KCachegrind. Install that first.
#> apt-get install kcachegrind
Now it's time to do some profiling. Load the script you want to analyze in your browser and append the variable XDEBUG_PROFILE to the URL. Eg:
http://localhost/dokuwiki/doku.php?id=wiki:syntax&purge=1&XDEBUG_PROFILE
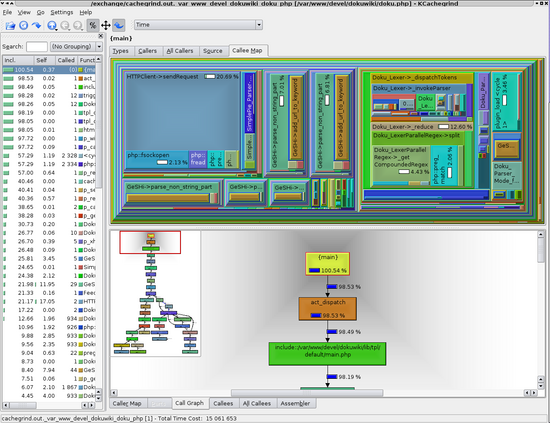
The parameter triggers the profiler and a log will be created. The created file 1) can then be loaded in KCachegrind. Here is an example screenshot:
The tool is very intuitive to use. The list of called functions on the left can be sorted by various parameters like time or number of calls. On the right pane different visualizations can be used. The “Call Graph” is a good starting point to understand how various parts of the code interact. The “Callee Map” shows the time spent in different code parts as blocks of different sizes. The bigger a block, the more time the function took.
Unfortunately no memory information is contained in the profiling info . This brings us to a second method of using Xdebug, described in the next section.
Function Tracing
The Xdebug profiling is an excellent method to get an quick overview over a whole script. But to analyze smaller parts of the code, for example a DokuWiki plugin, function tracing is the better solution.
Function tracing is enabled directly from within your PHP code. To start tracing you call the xdebug_start_trace function, when done call xdebug_stop_trace. The first function takes the log file as first argument.
xdebug_start_trace('/tmp/mytrace');
...
php code to trace
...
xdebug_stop_trace();
Again the file can grow very large, depending on the amount of traced code. This time no graphical tool for analyzing the data exists. But the used format is very readable. Here is an extract from a typical trace:
    0.0845    1299532       +0               -> is_file() /var/www/devel/dokuwiki/inc/pluginutils.php:32
    0.0846    1299532       +0               -> readdir() /var/www/devel/dokuwiki/inc/pluginutils.php:30
    0.0847    1299532       +0               -> closedir() /var/www/devel/dokuwiki/inc/pluginutils.php:51
    0.0848    1299388     -144             -> plugin_load() /var/www/devel/dokuwiki/inc/events.php:136
    0.0849    1299508     +120               -> file_exists() /var/www/devel/dokuwiki/inc/pluginutils.php:76
    0.0862    1316764   +17256               -> include_once(/var/www/devel/dokuwiki/lib/plugins/data/action.php) /var/www/devel/dokuwiki/inc/pluginutils.php:77
    0.0863    1316788      +24                 -> defined() /var/www/devel/dokuwiki/lib/plugins/data/action.php:8
    0.0870    1323020    +6232                 -> require_once(/var/www/devel/dokuwiki/lib/plugins/action.php) /var/www/devel/dokuwiki/lib/plugins/data/action.php:9
    0.0871    1323068      +48                   -> defined() /var/www/devel/dokuwiki/lib/plugins/action.php:9
    0.0872    1323068       +0                   -> defined() /var/www/devel/dokuwiki/lib/plugins/action.php:11
    0.0902    1404148   +81080                   -> require_once(/var/www/devel/dokuwiki/inc/plugin.php) /var/www/devel/dokuwiki/lib/plugins/action.php:12
    0.0906    1408152    +4004               -> class_exists() /var/www/devel/dokuwiki/inc/pluginutils.php:87
The file logs the time (from start of the script), the allocated memory, a memory delta, the function call and the source file with line number.
Xdebug is a handy and very powerful tool for PHP developers and I havn't introduced half of its features here. Check their website for more infos.
/tmp/cachegrind.out._var_www_dokuwiki_doku_php